-
[R] Plotly 에서 marker 사용하기Programing/Data Science 2020. 2. 24. 13:18
R를 사용해 데이터에 대한 그래프를 그려야할 때가 있는데요.
기존에는 ggplot2 라이브러리를 사용하고 있었는데 친구의 추천으로 plotly를 사용해 보았습니다.
plotly 라이브러리의 특징으로는 우선 사용하기 쉽고 다양한 언어(R, Python and Matlab)를 지원하고 있습니다. 그리고 html 포맷으로 plot한 그래프를 export 할 수 있는데 마우스의 움직임에 따라 해당 데이터의 값이 주석으로 표시되는데 주석이 표시되는 위치나 포맷을 사용자가 원하는 대로 수정이 가능합니다.
그리고 확대/축소 기능으로 특정 데이터나 그래프의 일부분을 원하는 크기로도 볼 수 있습니다.
Plotly사이트에는 2D, 3D 등 다양한 종류의 예제 코드를 제공하게 있어서 쉽게 따라할 수 있습니다..
여기서는 그래프의 한 종류인 scatter 의 마커 그래프를 그리는 방법에 대해 좀 더 알아보려고 합니다.
-
마커의 심볼 및 크기 수정하기
### Change symbols and size of marker
### val of Symbols: https://plot.ly/r/reference/#scatter-marker-symbol
plot_ly(data = mtcars,
            x = ~wt,
            y = ~mpg,
            type='scatter',
            mode='markers',
            symbol= ~as.factor(cyl),
            symbols= c("circle", "x", "o"),
            marker=list(size=5))
Symbols and size of markers -
범례 문자 기울기 수정하기
plot_ly(data=mtcars,
             x = ~wt,
             y = ~mpg,
             type ='scatter',
             mode = 'markers',
             symbol = ~as.factor(cyl),
             symbols = c('circle', 'x', 'o'),
             marker = list(size=5)) %>%
        layout(legend=list(orientation='h'))
범례 -
범례 위치 수정하기
### Change the orientation of the legend (outside the plot) ###
### Left bottom of plot is the origin
### if the value == 1, the legend will be located outside, otherwise it is inside of plot
plot_ly(data=mtcars,
             x = ~wt,
             y = ~mpg,
             type ='scatter',
             mode = 'markers',
             symbol = ~as.factor(cyl),
             symbols = c('circle', 'x', 'o'),
             marker = list(size=5)) %>%
  layout(legend=list(x = 0.8, y = 0.9))
범례 위치 -
마우스 포커스 인 때 표시되는 문자열 변경하기
### Customize the text over the mouse
plot_ly(data=mtcars,
             x = ~wt,
             y = ~mpg,
             type ='scatter',
             mode = 'markers',
             hoverinfo = "text",
             text=paste("Miles per gallon", mtcars$mpg, "<br>", "Weight: ", mtcars$wt)
             )
포커스인 문자열 변경 -
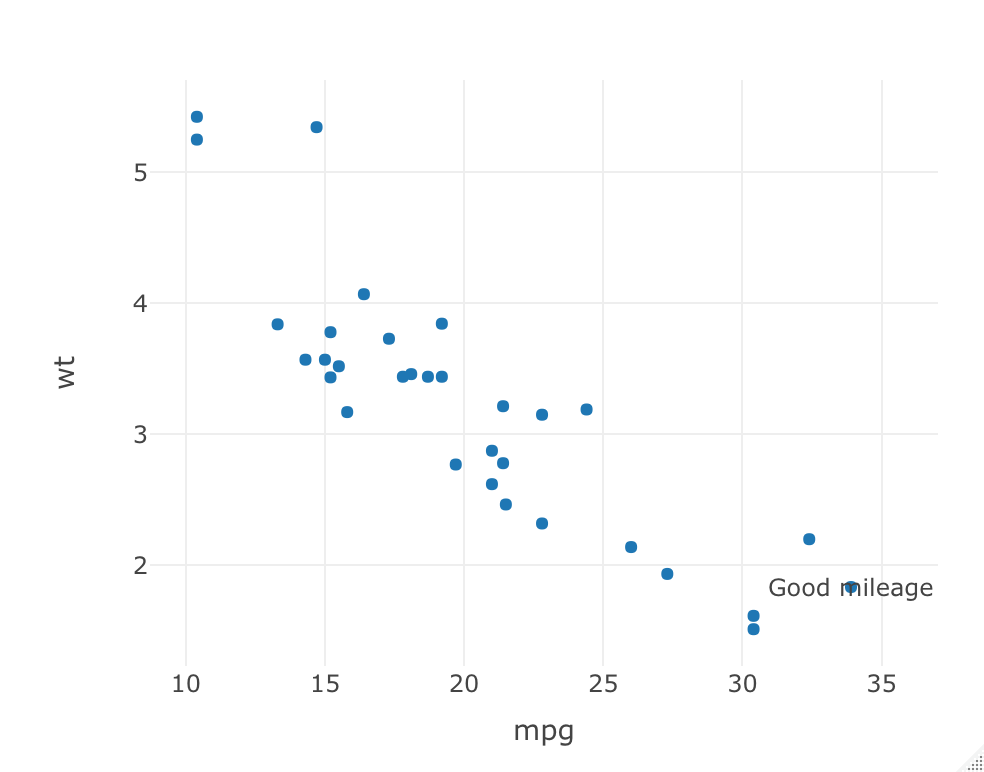
주석 추가하기
### Add annotations to the plot - add_annotations() function syntax
### Example of annotations on a single data points ###
### Display annotations for good mileage
plot_ly(data=mtcars,
        x = ~mpg,
        y = ~wt,
        type='scatter',
        mode='markers') %>%
  add_annotations(x = mtcars$mpg[which.max(mtcars$mpg)],
                  y = mtcars$wt[which.max(mtcars$mpg)],
                  text="Good mileage",
                  showarrow=F)
주석 달기 -
주석 위치 정하기
### Example of annotations - placing text a a desired location on the plot ###
## Display Data Source
### Demo of x/y ref as 'paper'
plot_ly(data=mtcars,
        x = ~mpg,
        y = ~wt,
        type='scatter',
        mode='markers') %>%
  add_annotations(xref="paper",
              yref="paper",
              x = 0.5,
              y = 1,
              text="Data Source : mtcars",
              showarrow=F)
주석 위치 -
2개 주석 달기
### Add Multiple annotations to the plot - add_annotations() function syntax
### Example of annotations on a single data points ###
### Display annotations for good and bad mileage
plot_ly(data=mtcars,
        x = ~mpg,
        y = ~wt,
        type='scatter',
        mode='markers') %>%
  add_annotations(x = mtcars$mpg[which.max(mtcars$mpg)],
                  y = mtcars$wt[which.max(mtcars$mpg)],
                  text="Good mileage",
                  showarrow=F)%>%
  add_annotations(x = mtcars$mpg[which.min(mtcars$mpg)],
                  y = mtcars$wt[which.min(mtcars$mpg)],
                  text="Bad mileage",
                  showarrow=F)
2 개의 주석 달기 -
조건에 맞는 데이터 값에 주석달기
### Example #2 of annotations on multipile data points ####
# Display annotations for automatic transission cars
plot_ly(data=mtcars,
        x = ~mpg,
        y = ~wt,
        type='scatter',
        mode='markers') %>%
    add_annotations(x = mtcars$mpg[mtcars$am == 0]+2,
                    y = mtcars$wt[mtcars$am == 0],
                    text="auto",
                    showarrow=F)
조건에 따른 주석 달기 -
주석 문자열 스타일 변경하기
### Styling annotations ###
# using font argument
plot_ly(data=mtcars,
        x = ~mpg,
        y = ~wt,
        type='scatter',
        mode='markers') %>%
  add_annotations(x = mtcars$mpg[which.max(mtcars$mpg)],
                  y = mtcars$wt[which.max(mtcars$mpg)],
                  text="Good mileage",
                  font=list(color="green", family="sans serif", size= 15))
주석 스타일 변경하기 -
X 또는 Y 축 범위 설정하기
### Set the range of Y axis
yaxis <- list(
  title = 'Y-axis Title',
  #ticktext = list('long label','Very long label','3','label', "what", "The", "Seven"),
  #tickvals = list(1, 2, 3, 4, 5, 6, 7),
  #tickmode = "array",
  range=list(0,10)
  #automargin = TRUE,
  #titlefont = list(size=30)
)
plot_ly(x = c('Apples', 'Oranges', 'Watermelon', 'Pears'), y = c(3, 1, 2, 5), width = 500, height = 500, type = 'bar') %>%
  layout(yaxis = yaxis)
Y 축 범위 설정하기 -
X 또는 Y축 표시 및 그리드 변경하기
### Set the range of scale at axis
## Disable autoscale according to the x or y-axis data
xaxis <- list(
  title = 'X Axis',
  ticktext = list('10','30','60'),
  tickvals = list("10", "30", "60"),
  tickmode = "array",
  titlefont = list(size=10)
)
yaxis<-list(
  title = 'Y Axis',
  tick0 = 0,
  dtick = 0.1,
  tickangle = 45,
  gridwidth = 2,
  fixedrange=T,
  range= c(0, 1),
  autosize=T,
  titlefont = list(size=10)
)
short_drop = list(0.005, 0.0133, 0.0158)
short_wait = list(0.03, 0.0383, 0.0392)
long_drop = list(0.45, 0.8517, 0.9642)
long_wait = list(0.255, 0.7683, 0.9892)
x_data = list("10", "30", "60")
plot_ly (type='scatter', mode='markers') %>%
  add_trace(x= x_data,y = short_drop, name = "A", marker=list(symbol="x", size=10) ) %>%
  add_trace(x= x_data, y = short_wait, name = "B", marker=list(size=10) ) %>%
  layout(xaxis = xaxis, yaxis=yaxis)
축 표시 및 범위 변경하기 'Programing > Data Science' 카테고리의 다른 글
[엑셀] CSV 파일 저장시 구분자 변경 (0) 2022.02.11 [R] Grouped Bar Chart by plotly (0) 2021.03.08 [Plotly][ValueError] executable=" ".join(executable_list), help_result=help_result (0) 2020.04.03 [Python] subplot 에 shape 추가하기 (0) 2020.04.03 [R] color names (0) 2020.03.26 -